- Справка
- Описание сервиса
- Быстрый старт
- Часто задаваемые вопросы
- Я оплачиваю за один счет или за весь сервис?
- Я не могу войти в личный кабинет / хочу сменить пароль
- Что если я сменил брокера или биржу, как это отразить в сервисе?
- Ознакомительная версия. Тестовый доступ
- Почему у меня не загружается отчет брокера?
- Требование к отчету для подключения
- Даты некоторых сделок в отчете старше дат, за которые данные уже загружены
- Помогите мне все настроить
- Результаты по счету не отражают действительность
- Мне не подходят указанные способы входа/выхода. Пользовательские столбцы
- Как ввести начальные позиции
- Виды подписок, отличие тарифов
- Видео часто задаваемые вопросы
- Подключенные отчеты брокеров и платформы
- Универсальный отчёт
- UX
- USA
- Журнал статистики
- Arche
- APEX
- AvalonFund Activ
- АльфаБанк (биржа СПБ)
- ATAS
- Blackwood
- bbrok
- BrokerCrediService
- CYGroup
- Colmex
- DAS
- Daytraderclub
- Exante trades
- Fondexx (sterling)
- Fondexx (Alpha Trader)
- Freedom Finance Кипр
- Freedom Finance
- Fusion
- Финам (ROX)
- GrayBox
- General Trade
- Gerchik&Co Stocks
- Lightspeed
- Interactive Brokers
- LabDea
- Laser
- MIG (Fusion)
- MB trading
- Orbis Pro Trader
- Открытие
- PPro8
- ROX
- SDG
- Sterling
- Shark Traders
- Thinkorswim
- Тинькофф Банк (биржа СПБ)
- Trade Up
- TradeSpeed
- Trader Workstation (TWS)
- TradeZero
- Takion
- United Traders
- РТС(Фортс)
- Журнал статистики
- Алор
- Альфа-банк
- Атон
- A-Lab
- ATAS
- Arche
- EasyScalp
- БрокерКредитСервис
- ВТБ24 (QUIK)
- OnlineBroker VTB24
- Газпромбанк (QUIK)
- Зенит
- IT Invest
- I-NVEST
- Кит Финанс
- MetaTrader 5
- Nettrader
- QUIK
- Открытие
- Открытие Единый счет
- Промсвязьбанк
- РИК - Финанс
- РосЕвроБрокер
- Солид
- Сбербанк
- Transaq
- TigerTrade
- TSLab
- Трейд-Портал
- Універ
- УНИВЕР Капитал
- УРАЛСИБ Кэпитал
- United Traders
- Just2Trade (Whotrades)
- Volfix
- Финам
- Церих
- ММВБ (Московская биржа фондовая секция)
- Журнал статистики
- Алор
- Алор (из терминала Алор Трейд)
- Атон
- A-Lab
- ATAS
- Альфа-банк
- БКС
- ВТБ24 (QUIK)
- OnlineBroker VTB24
- Газпромбанк (QUIK)
- IT Invest
- Церих
- Кит Финанс
- Nettrader
- Открытие
- Открытие Единый счет
- Промсвязьбанк
- Сбербанк
- Тинькофф Банк
- Трейд-Портал
- Transaq
- TSLab
- УНИВЕР Капитал
- УРАЛСИБ Кэпитал
- Финам
- Freedom Finance Кипр
- Just2Trade (Whotrades)
- FOREX
- CME
- Бинарные опционы
- Счета. Настройка счетов. Управление счетами
- Что такое счет?
- Панель управления счетами
- Создание счета
- Редактирование счета
- Активация или продление счета
- Настройки отображения данных. Как добавить/убрать столбцы в таблице сделок. Как добавить пользовательские столбцы.
- Настройка соответствия названий инструментов
- Заполнение счета демо-данными
- Создание ссылки на просмотр счета
- Связанные счета
- Сделки. Управление сделками
- Что такое сделка? Атрибуты сделки.
- Панель управления сделками
- Таблица сделок
- Редактор сделок
- Способы внесения сделок
- Алгоритмы автоматического формирования сделок
- Как ввести начальные позиции
- Загрузка отчета брокера
- Массовое редактирование сделок
- Дублирование сделок
- Объединение сделок
- Удаление сделок
- Корректировка результатов сделок
- Добавление комментария к сделке
- Добавление скриншотов к сделке
- Выгрузка сделок в Excel
- Резервные копии сделок
- СТАТИСТИКА
- Для групп трейдеров
- Дневник
- Вкладка "Профиль"
- Требования к программному обеспечению
- Условия предоставления сервиса.
- Пополнение баланса и оплата услуг
- Бонусы
- Партнерская программа
- Обучение
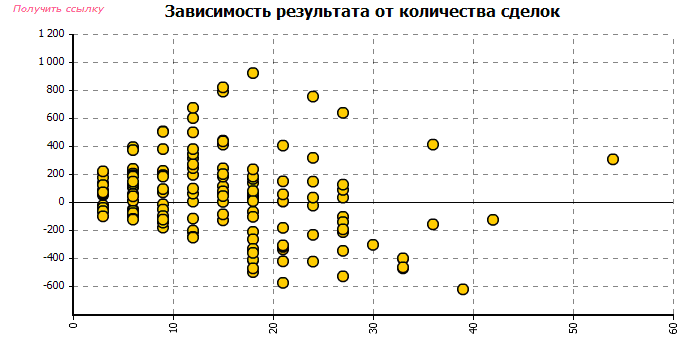
График зависимости результата от количества сделок
Каждая точка графика зависимости результата от количества показывает абсолютный результат, где по оси X - количество сделок за день. Предполагается, что при достаточном наборе статистических данных, могут образовываться скопления точек, которые покажут наиболее комфортное количество сделок в день.
