- Справка
- Описание сервиса
- Быстрый старт
- Часто задаваемые вопросы
- Я оплачиваю за один счет или за весь сервис?
- Я не могу войти в личный кабинет / хочу сменить пароль
- Что если я сменил брокера или биржу, как это отразить в сервисе?
- Ознакомительная версия. Тестовый доступ
- Почему у меня не загружается отчет брокера?
- Требование к отчету для подключения
- Даты некоторых сделок в отчете старше дат, за которые данные уже загружены
- Помогите мне все настроить
- Результаты по счету не отражают действительность
- Мне не подходят указанные способы входа/выхода. Пользовательские столбцы
- Как ввести начальные позиции
- Виды подписок, отличие тарифов
- Видео часто задаваемые вопросы
- Подключенные отчеты брокеров и платформы
- Универсальный отчёт
- UX
- USA
- Журнал статистики
- Arche
- APEX
- AvalonFund Activ
- АльфаБанк (биржа СПБ)
- ATAS
- Blackwood
- bbrok
- BrokerCrediService
- CYGroup
- Colmex
- DAS
- Daytraderclub
- Exante trades
- Fondexx (sterling)
- Fondexx (Alpha Trader)
- Freedom Finance Кипр
- Freedom Finance
- Fusion
- Финам (ROX)
- GrayBox
- General Trade
- Gerchik&Co Stocks
- Lightspeed
- Interactive Brokers
- LabDea
- Laser
- MIG (Fusion)
- MB trading
- Orbis Pro Trader
- Открытие
- PPro8
- ROX
- SDG
- Sterling
- Shark Traders
- Thinkorswim
- Тинькофф Банк (биржа СПБ)
- Trade Up
- TradeSpeed
- Trader Workstation (TWS)
- TradeZero
- Takion
- United Traders
- РТС(Фортс)
- Журнал статистики
- Алор
- Альфа-банк
- Атон
- A-Lab
- ATAS
- Arche
- EasyScalp
- БрокерКредитСервис
- ВТБ24 (QUIK)
- OnlineBroker VTB24
- Газпромбанк (QUIK)
- Зенит
- IT Invest
- I-NVEST
- Кит Финанс
- MetaTrader 5
- Nettrader
- QUIK
- Открытие
- Открытие Единый счет
- Промсвязьбанк
- РИК - Финанс
- РосЕвроБрокер
- Солид
- Сбербанк
- Transaq
- TigerTrade
- TSLab
- Трейд-Портал
- Універ
- УНИВЕР Капитал
- УРАЛСИБ Кэпитал
- United Traders
- Just2Trade (Whotrades)
- Volfix
- Финам
- Церих
- ММВБ (Московская биржа фондовая секция)
- Журнал статистики
- Алор
- Алор (из терминала Алор Трейд)
- Атон
- A-Lab
- ATAS
- Альфа-банк
- БКС
- ВТБ24 (QUIK)
- OnlineBroker VTB24
- Газпромбанк (QUIK)
- IT Invest
- Церих
- Кит Финанс
- Nettrader
- Открытие
- Открытие Единый счет
- Промсвязьбанк
- Сбербанк
- Тинькофф Банк
- Трейд-Портал
- Transaq
- TSLab
- УНИВЕР Капитал
- УРАЛСИБ Кэпитал
- Финам
- Freedom Finance Кипр
- Just2Trade (Whotrades)
- FOREX
- CME
- Бинарные опционы
- Счета. Настройка счетов. Управление счетами
- Что такое счет?
- Панель управления счетами
- Создание счета
- Редактирование счета
- Активация или продление счета
- Настройки отображения данных. Как добавить/убрать столбцы в таблице сделок. Как добавить пользовательские столбцы.
- Настройка соответствия названий инструментов
- Заполнение счета демо-данными
- Создание ссылки на просмотр счета
- Связанные счета
- Сделки. Управление сделками
- Что такое сделка? Атрибуты сделки.
- Панель управления сделками
- Таблица сделок
- Редактор сделок
- Способы внесения сделок
- Алгоритмы автоматического формирования сделок
- Как ввести начальные позиции
- Загрузка отчета брокера
- Массовое редактирование сделок
- Дублирование сделок
- Объединение сделок
- Удаление сделок
- Корректировка результатов сделок
- Добавление комментария к сделке
- Добавление скриншотов к сделке
- Выгрузка сделок в Excel
- Резервные копии сделок
- СТАТИСТИКА
- Для групп трейдеров
- Дневник
- Вкладка "Профиль"
- Требования к программному обеспечению
- Условия предоставления сервиса.
- Пополнение баланса и оплата услуг
- Бонусы
- Партнерская программа
- Обучение
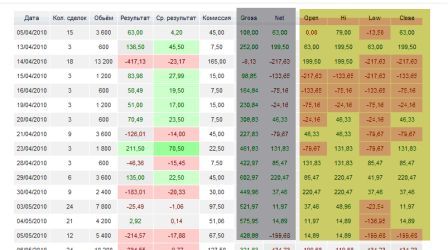
Сводная таблица
В сводной таблице показаны общие результаты, сгруппированные по дням.

Каждая строка отражает:
Дата - торговый день, сделка попадает в торговый день по закрытию, т.е. по дате окончания сделки
Кол. сделок - количество сделок в день,
Объем - проторгованный объем*,
Результат - чистый результат с учетом комиссии,
Ср.результат - средний результат на сделку,
Комиссия - общую комиссию за день,
Gross - результат без комиссии, учитываемый накопительным итогом, изо дня в день.
Net - результат с учетом комиссии, учитываемый накопительным итогом.
Open - общий результат за весь период на начало дня.
Hi - показывает, каким бы стал общий результат, если бы торговля в этот день закончилась на сделке, которая в совокупности с остальными дала бы лучший результат в течение этого дня. (считается только по закрытым сделкам)
Low - показывает, каким бы стал общий результат, если бы торговля в этот день закончилась на сделке, которая в совокупности с остальными дала бы худший результат в течение этого дня. (считается только по закрытым сделкам)
Close - общий результат за весь период на конец дня.
Open, Hi, Low, Close - используются для диаграммы OHLCV, в которой показываются результаты торговли в виде биржевого графика.
* Объем имеет смысл анализировать для NYSE, так как все лоты одинакового размера, либо применив фильтр по конкретному инструменту. В других случаях, его показатель бесполезен.